Fiscal Maths
Last updated: Apr 27, 2023This article is being written by me keeping the closing of the FY 2022-23 in mind. Q4 of any financial year is always a period of intense accounting, analysis and reporting as well as planning for the coming year. On 31st Jan 2023, the Economic Survey 2022-23, as prepared by the Chief Economic Advisor (in the Department of Economic Affairs, Ministry of Finance) was released and tabled by the Hon’ble Finance Minister in the Parliament. This survey is famous for its analysis of various economic trends, which give powerful insights into the state of the Indian Economy. On 1st February, 2023, the Finance Minister tabled the Union Budget 2023-24 prepared by the same department and ministry. On 28th February 2023, the NSO, MoSPI released the Second Advance Estimates of GDP for FY ‘23. Lets analyse some data from these 3 documents.
For convenience I shall only deal with highly approximate figures.
All values are advance estimates as on 31st March, 2023
All values including GDP are annual ie. they start from zero every year. FY 2023 is considered in this article.
Shorthand : 1 LC => 1 Lakh Crore , 1 tr => 1 trillion
1 LC = 1 tr = \(10^{12}\)
$1 tr = $1 x \(10^{12}\) = ₹ 100 x LC = ₹ 100 LC
India’s Real GDP (@ constant prices of 2011-12) = ₹ 150 LC = $ 1.5 tr
India’s Nominal GDP (@ current market prices) = ₹ 300 LC = $ 3 tr
As per Receipt Budget of India ,
GoI’s Internal Debt = ₹ 145 LC
GoI’s External Debt = ₹ 5 LC (nb. ECB is nearly 4 times this Sovereign ext. debt of ₹ 5 LC)
∴ GoI’s Public Debt = ₹ 150 LC = $ 1.5 tr = 50% of nominal GDP
Similarly State’s public debt is 30% of nominal GDP.
Hence Total Public Debt = 80% of nominal GDP
(Nb. As per ES23, India’s Ext. Sovereign debt rose to ₹ 10 LC and ECB proportionately)
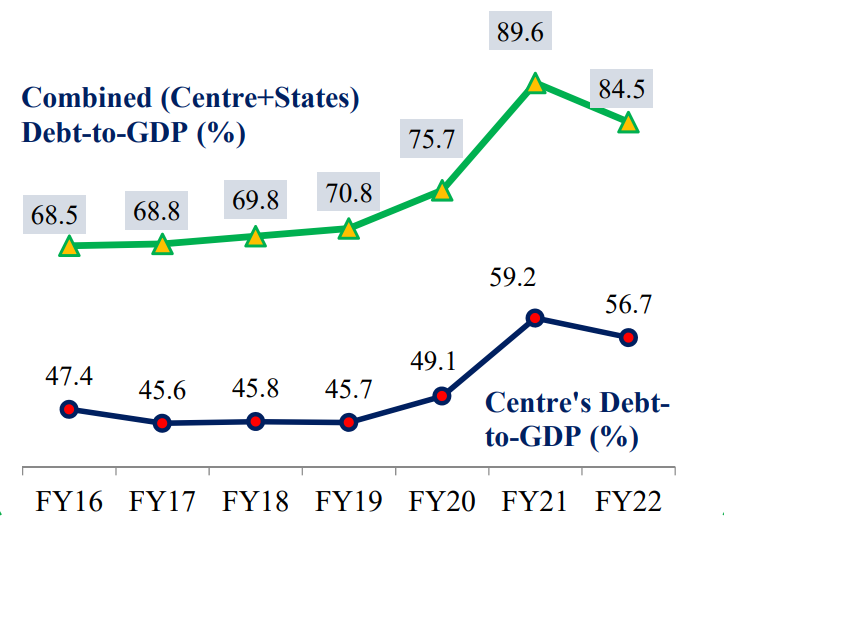
The below charts are taken from the official Economic Survey Infographics. The first one shows the trend of Total Public Debt/GDP ratio over the years. As per FRBM Act, 2003, the target is 60% (= 40% GoI + 20% GoS)
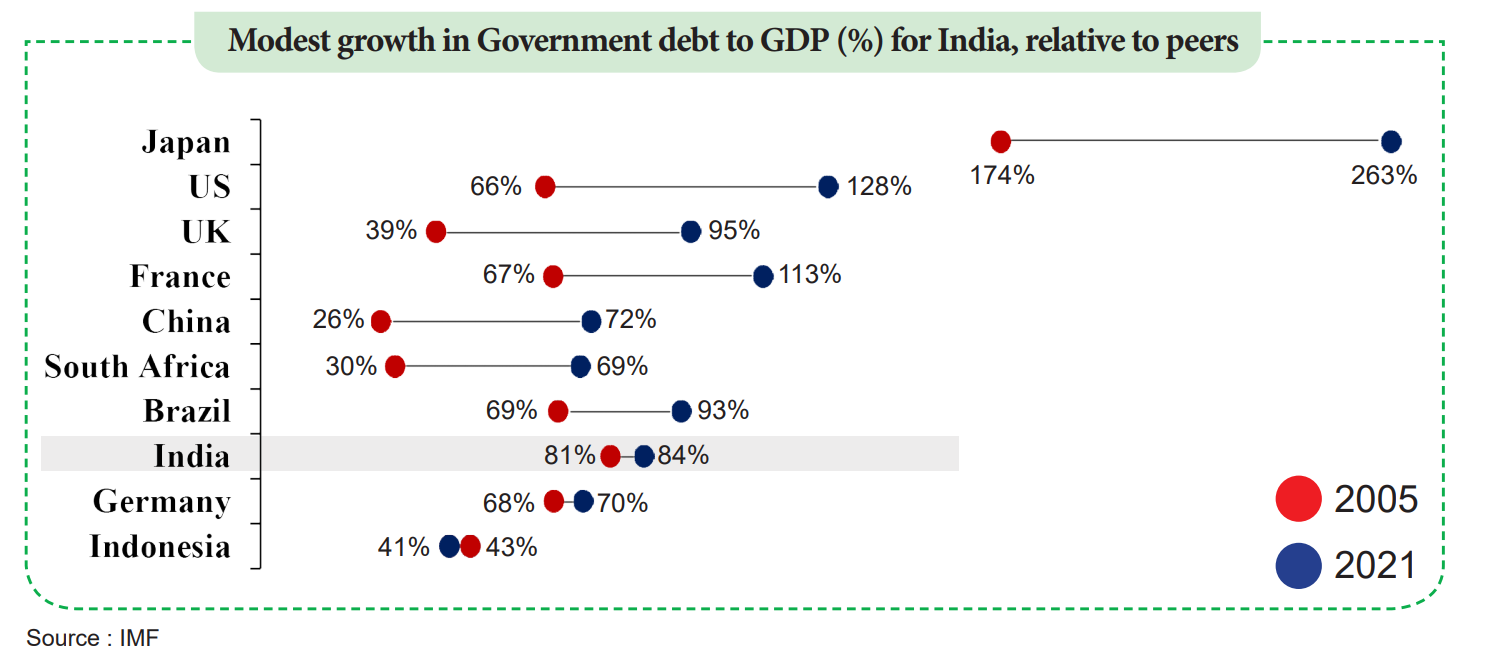
The second chart above reflects that India’s total public debt hasn’t worsened as much as many other countries. Moreover most of India’s public debt is Internal which indicates that the risk is domestic and not external as was in case of Greece or Sri Lanka.
Some other facts from the Budget analysis are :
Total expenditure of GoI = ₹ 45 LC (15% of nominal GDP)
Total Tax Revenue of GoI = ₹ 30 LC (10% of nominal GDP)
∴ Total borrowings of GoI = Fiscal deficit = 45 LC -30 LC = ₹ 15 LC (5% of GDP)